Ground-Penetrating Radar (GPR)
GPR stands for Ground-Penetrating Radar – an imaging technology originally developed in geophysics for earth exploration. In the following sections, we will first describe the principles of GPR, and then explain how it can be used to locate subsurface objects, image concrete or map rebar corrosion.
1. How it works
GPR operates based on the behavior of electromagnetic (EM) wave propagation. Specifically, when a beam of EM energy encounters an interface between two media of contrasting dielectric constants, a portion of energy is reflected back. The remainder penetrates into the next medium. By recording and analyzing such reflections, we can identify within concrete the presence of buried objects, material layers, structural defects, or foreign inclusions.
To scan a concrete structure, an operator either pushes GPR antenna manually or attaches it to a vehicle. At each location, the transmitting element of the antenna emits a short pulse of EM signal. Another element of the antenna (bistatic mode) or the same one (monostatic mode) will monitor and record the energy reflected back from various interfaces to its location. Such a recording occurs within a certain period of time to produce an A-scan signal. The entire process repeats for the next locations along the survey line to create an image, which is called B-scan.
A simulation showing how GPR works for concrete imaging
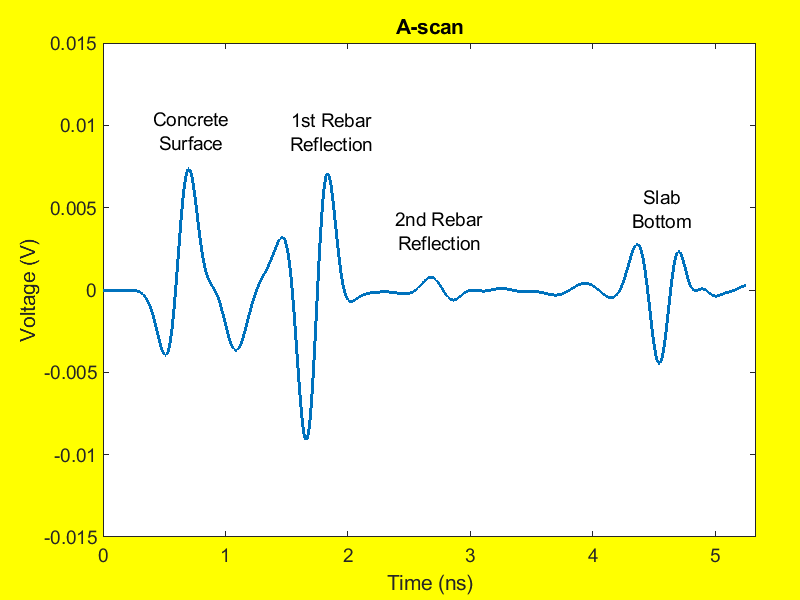
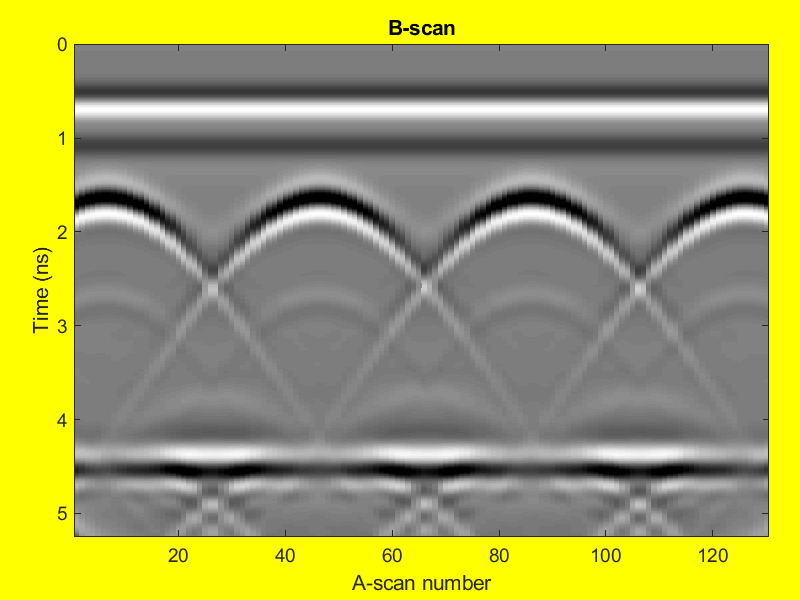
We have created the above clip to illustrate such working principle. It simulates the use of GPR in bistatic mode for a short slab section. The slab has a thickness of 20 cm in which four black dots represent steel bars. The red and blue marks indicate respectively the transmitting and receiving antenna elements. The antenna moves from the left to the right of the screen to scan the slab section. In the following, Fig. 1 depicts an A-scan at one location while Fig. 2 shows the B-scan obtained from the simulated survey line.
2. Typical features on GPR B-scans
2.1. Direct air wave & direct-coupling reflection
We will now discuss some features that you usually observe in GPR B-scans. To start, let us talk about the horizontal, straight line on top of every B-scan. For an air-horn antenna, i.e., antenna held in the air, that waveform represents the direct air wave between transmitting and receiving antenna elements. On the other hand, for a ground-coupled antenna, it is a mixture between the direct air wave and the reflection from ground or concrete surface. In GPR language, such a mixture is usually called direct-coupling reflection.
2.2. Hyperbolic signatures
Another typicality in B-scan images is with regard to hyperbolic patterns. As can be seen from the clip, they exist due to the varying distance from the antenna to the reflecting objects when it moves across the survey section. Specifically, the tails of a hyperbola correspond to the locations of antenna where it see the object from the longest distance. On the other hand, the apex of the hyperbola corresponds to the position of the antenna where it is closest to the object in question. Obviously, it is also where we should have the strongest reflection for each hyperbola.
3. GPR Applications
3.1. Rebar, PT cable & utility locating
Marking locations of steel bars, prestressing strands, cables, conduits or subsurface utilities has been the most common application of GPR. It happens when a structure owner or contractor want to saw, drill into concrete or dig into ground for structural repair or some other reasons. In those cases, the objective of GPR scanning will be to avoid cutting into such structurally/functionally important elements. As you should realize, this type of project usually does not require the collection of GPR data in pre-defined grid lines or data post-processing. Instead, a GPR technician will simply scan locations where the cutting, drilling or digging will occur.
3.2. Concrete & subsurface imaging
What you have seen so far are raw GPR data, images, or signals. We will need to process such data to obtain true images or other pieces of information, e.g. member thickness, rebar depth, bar spacing, etc. Fortunately, in geophysics, there exist several data processing methods for us to do so. Those include synthetic aperture focusing technique (SAFT) or migration algorithms. To explain, such algorithms work by projecting each A-scan back into the imaged space/region. Then, through superimposing the obtained images, the pixel intensities will be added up and be distinct at the true object locations.
3.3. Concrete corrosion mapping
A powerful application of GPR is to evaluate the effects of corrosion in reinforced concrete structures such as bridge decks or parking garages. The premise is that the corrosive environment in concrete will absorb more EM energy and attenuate more GPR signals. That said, a common practice for such evaluation is to plot reflection amplitudes at top rebar layer into a form of contour map. Then, after applying some appropriate method of normalization, we can say the following. The areas with strong amplitudes on the map represent sound/good concrete. On the other hand, the areas of low amplitude indicate corrosive environment.